
We all know it: great business presentations are key to leadership success. So it might be worth spending some time improving these presentations.
But how do you best improve them? By asking for feedback?
Very often we hear the following if we ask for feedback: “It was ok”; “Weeeellll”; “Yeah”; or “You were nervous”; And so on.
Sounds familiar? Not very actionable feedback.
I think we can go a bit deeper and a bit more analytical. As a former finance executive I like to put things in numbers. Therefore I have developed several metrics that I track for my own keynote presentations as well as for my coaching.
Here are five metrics that I propose that every business presenter and their managers should look at. Some are straight-forward, some are more advanced:
- Words per minute
- Structure Distribution
- Movements per minute
- Slides per minute
- Laughs per minute
Let’s dive into each of them:
Word metric: “Words per minute”
This metric is also sometimes called “speech rate” and has been widely studied by researchers, also e.g. for radio commentators. Words per minute can have a massive impact on audience comprehension and persuasiveness of your presentation.
For a 10-minute presentation, in your opinion, how many words do you typically have?
I always to reduce my speech to +/- 100 words per minute, i.e. 1000 words for a 10 minute speech, as this seems to have the best comprehension impact.
It is interesting to plot this on a chart for a presentation. One common pattern for some presenters is that when they realize they are running out of time they speed up their presentation. They go then for instance from 100 to for instance 200 words per minute and their presentation pattern looks like this then:
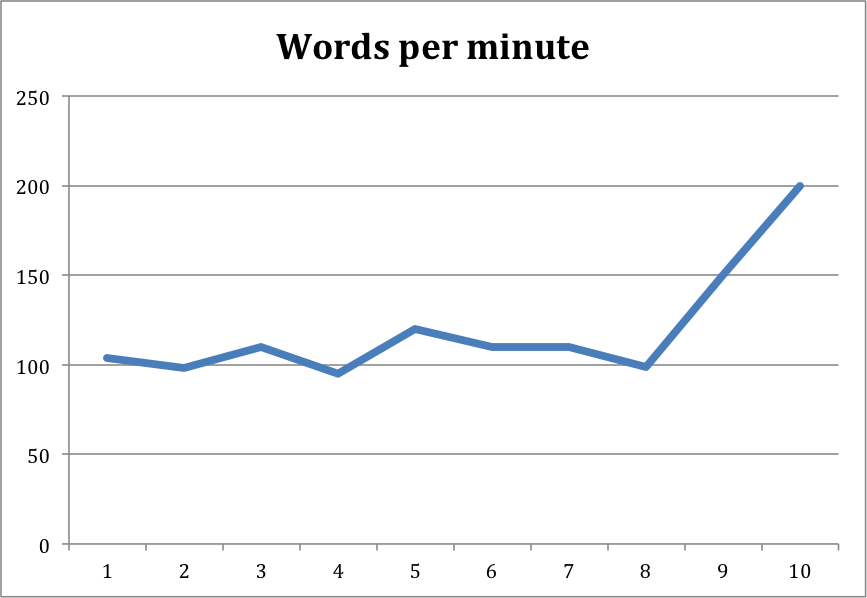
I call this the hockeystick presenter: speeding up at the end, going faster to still be able to say everything instead of being more choiceful. This typically affects the comprehension and lets the presenter look less convincing. Something to be avoided.
How can you assess your word count if you do not script your presentations? Record your presentations and send it to e.g. a program like Nuance’s Dragon to auto-transcribe it and do a word count in your word processor. It will give you a good indication.
Structure Metric: “Distribution of Content”
Someone once said: “A great speech has a great opening, a great ending, and hopefully not too much in between the two.”
While this is maybe a bit exaggerated for business presentations it shows the importance of beginnings and endings.
The extremes that I encounter in terms of distribution are the following:
- 40% of the time for the intro; 60% Body; 0% Conclusion: Endless introduction, some main parts that basically repeat the introduction; and then no time for a conclusion (“time is up”).
- 0% Introduction; 98% Body; 2% Conclusion: Another extreme, jumping directly into the main content without any introduction, context, or connecting back to the last time. This can leave the audience confused.
What do I recommend? Something around 10% for the introduction; 80% Main body; 10% conclusion. For example, in a 50 minute keynote presentation I typically give 5 minute intro and a 5 minute extro, leaving 40 minutes for the main part.
Delivery Metric: “Movement % per minute”
The extremes in terms of body movement during presentations are the following:
- 0% Movement: That is what one can call the “ancient statue” syndrom. No movement at all for the entire time.
- 100% Movement: That’s the “roaming presenter”: somebody who is walking all the time, which starts to get very soon on people’s nerves as they don’t know where to focus on.
At PresMaster, the online presentation coaching tool that I co-founded, we track this metric with Body Motion sensor technology with e.g. the MS Kinect device, to get blueprints of movement patterns:

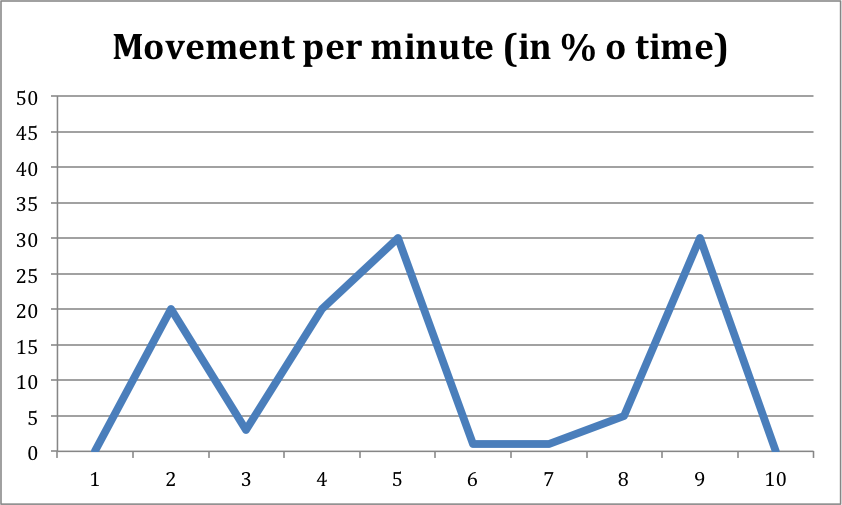
What is the best pattern, the best % of movement? Here, in my view it is actually not so much the actual average for the total presentation but rather the variability that is interesting.
An ideal pattern in my assessment is a mix of no body movements combined with occasional movement with a purpose, to e.g. highlight a point on the screen. A plotted chart would look like this:
Visuals metric: “Slides per minute”
Almost everybody I talk to has an idea in their head what that metric should be. You hear many managers for instance say:
“For a ten minutes presentation you need 4 slides.”
Which translates to 0.4 slides per minute.
In my experience, however, there is no one ideal number for this. Leaders should restrain from one-size-fits-all advice like this.
Instead, I believe you should track what works well for yourself. If you watch my typical keynotes you will see I have about 1.0-1.5 slides per minute. I have a relatively rapid pace and tell data & visual stories with my presentations.
A PechaKucha presentation has per definition always 3.0 slides per minute. Other great presenters use only one slide during a ten minutes presentation, i.e. a 0.1 slides per minute.
I recommend to check what slide/minute ratio works best for you, and then to double-check whenever you prepare a presentation if you are in that range and do not follow a “one size fits all” for you and your team members.
In my view, the most important thing is that you are finished on time, and that your audience is clear about your message.
Secret Sauce Metric: “Laughs per minute”
Three years ago I had the opportunity to give a keynote speech at the International Convention of Toastmasters in Orlando, Florida. The day before my speech they also held the semifinals of the World Championship of Public Speaking. These are nine semifinals with all the champions from more than 90 districts from all over the world.
When I was in the audience for the whole day I did a little analysis: I counted the number of laughter moments during each speech and calculated then the laughs per minute of the various presenters.

What would you estimate ? In the semifinals of the world championship, what the “average per-minute laugh”?
Here are the results:
- The average of all the semi-finals? 1.2 laughs per minute.
- The average of all anounced winners who achieved either 1st, 2nd, or 3rd place in the semi-finals? 1.7 laughs per minute.
- The average of all semi-final winners? 1.9 laughs per minute.
- And the average of the twenty most watched 3’ TED talks in 2012? 1.7 laughs per minute.
This is a pattern I also see during business conferences: The more laughs, the higher the rating of a presenter. Of course we have to be careful with causation versus correlation. And of course we do not give a speech to make people laugh, certainly not in a business context. We are not comedians.
However, if your speech has a “Laugh per minute” of 0.00001, I think you might want to work on that. The greatest business presenters speak also with a sense of humor, especially as a laughter moments can help to let a message sink better.
Therefore I suggest to track your laughs and spice it up with professional humor.
In closing: Go analytical!
Is applying these metrics more work? Yes.
But it is much easier to manage your own presentation success and to progress, and the payoff in the long run is well worth the effort.
You can set yourself targets and ask for feedback around specific metrics. And as a manager, this approach might give you a different angle for giving feedback to your team members. So go analytical.
Lars Sudmann is an expert on high-performance leadership in global corporations. He works with multinational organizations as change consultant, keynote speaker as well as workshop facilitator. Additionally, he is the co-author of the book “The Smart Presenter” and the co-founder of PresMaster, an award-winning software that helps presenters with metrics in their presentation preparation. This article is part of a series of blogs on “Metrics-based leadership” and also appeared on his blog: www.lars-sudmann.com. Follow Lars here.
Image credit: Shutterstock.com.
Do you want to read further? Here is a link to my top 10 books on speaking and presenting
Interested to see more advice on speaking? Watch my TEDx talk here: